Assessments / SRSS-IE
Teacher Dashboard
Overview
Completing the screening is only half of what the SRSS is for. The other half is the Teacher Dashboard — the view where you see your own students' results back, in the one place where someone who actually knows those students is looking at them.
That matters more than it sounds. District-level dashboards are good at showing patterns across buildings and grades. They are not good at catching the quiet eighth grader who has been drifting since last spring. You are. The dashboard exists to put the screening data in front of the person best positioned to act on it.
Available to certain districts as of the Fall 2026 release
Teacher access to the classroom-level view is enabled per district rather than on by default. If you do not see it, your district may not be enabled yet — your assessment coordinator can check with your Standard Education representative.
This is separate from administering the screening, which still happens through your private screening link and requires no login at all. See Teacher Links and Access.
This page covers what you can access and how to read it. For how accounts get set up, see Portal Access and Provisioning or ask your district assessment coordinator.
Opening the Dashboard
From the left sidebar: your school → Assessments → SRSS Scores – Teacher View.
The filters across the top set the school year and term. Change these when you want to look back at a previous window rather than the current one.
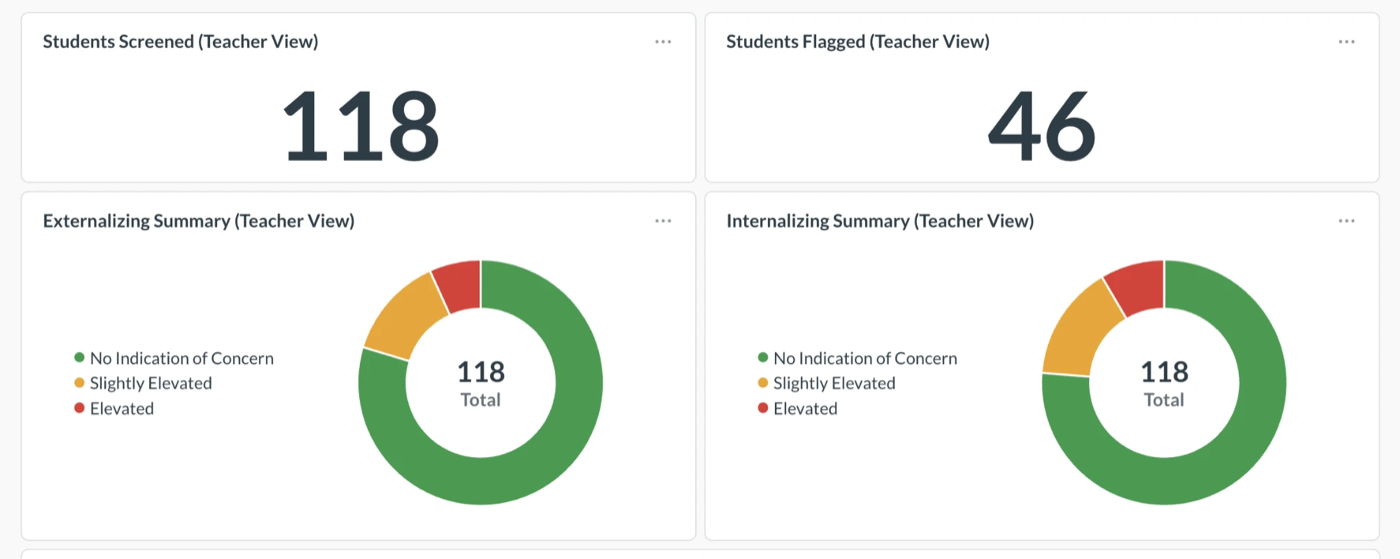
Two counts sit at the top of the page:
| Card | What it tells you |
|---|---|
| Students Screened | How many of your students have completed screenings on record |
| Students Flagged | How many came back elevated in either area |
Check the screened count first. If it is lower than your class size, some students were not screened — which is a roster problem, not a results problem. See Completing the Screening.
Below the counts, Externalizing Summary and Internalizing Summary break your class into the three tiers, with both a count and a percentage for each. Hover any segment to see the exact numbers. These are the fastest way to tell whether you are looking at a couple of individual students or a pattern across the whole class.
The Two Scores
Every student receives two separate scores. A student can be perfectly fine on one and elevated on the other, and that is exactly what the screener is built to surface.
Externalizing — outward behavior: disruption, aggression, defiance, trouble staying on task. This is the behavior you tend to notice already.
Internalizing — inward experience: withdrawal, anxiety, sadness, low energy. This is the one that is easy to miss, which is precisely why it is screened for.
Why both scores exist
A student who acts out gets noticed. A student who goes quiet often does not. Screening both dimensions is how a withdrawn student ends up on someone's list instead of having a quiet year that nobody flags until it becomes a crisis.
The three tiers
Each of the two scores falls into one of three tiers:
| Tier | What it means |
|---|---|
| No Indication of Concern | Tier 1 — core supports are working. |
| Slightly Elevated | Worth watching. Consider Tier 2 supports. |
| Elevated | Flagged for follow-up. A Tier 2 or Tier 3 conversation. |
These are the same three risk levels described as Low, Moderate, and High Risk elsewhere in these docs — the Teacher View uses the plainer wording. See Score Interpretation Guide for the cut scores behind each tier.
Students to Watch, and Your Full Roster
Scroll down and you get two tables.
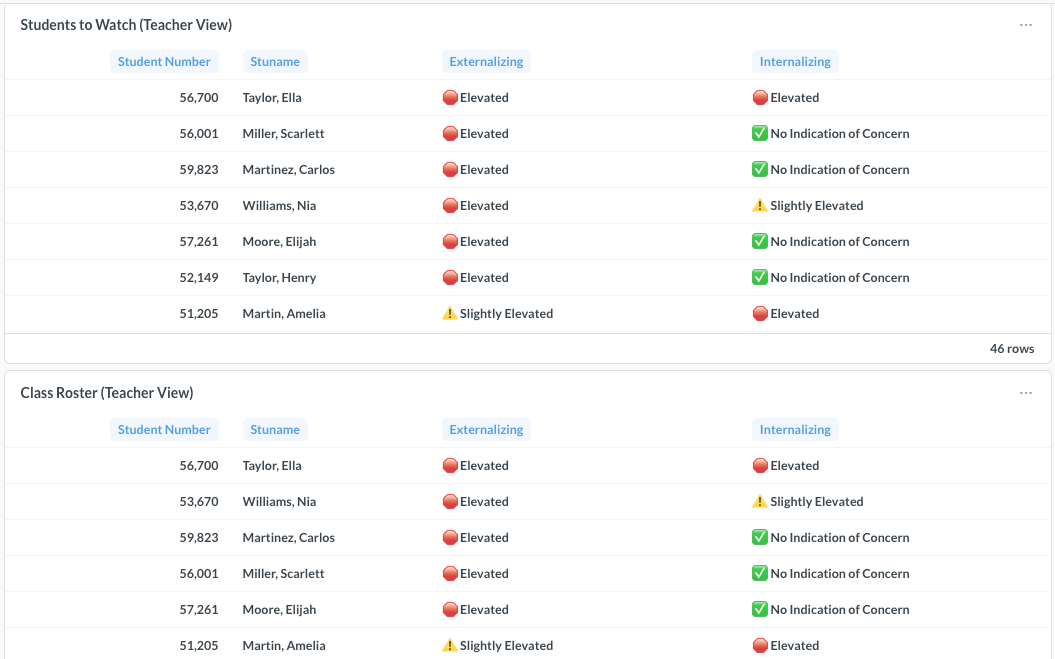
Students to Watch pulls out everyone flagged in either area. This is the short list, and it is where to start — it is the dashboard doing the triage for you.
Class Roster shows everyone you screened, flagged or not. Use it when you want the full picture, or to confirm a particular student is actually on your list.
The Student Snapshot
Click any Student Number to open that student's snapshot. It shows the most recent scores plus every prior screening on record.
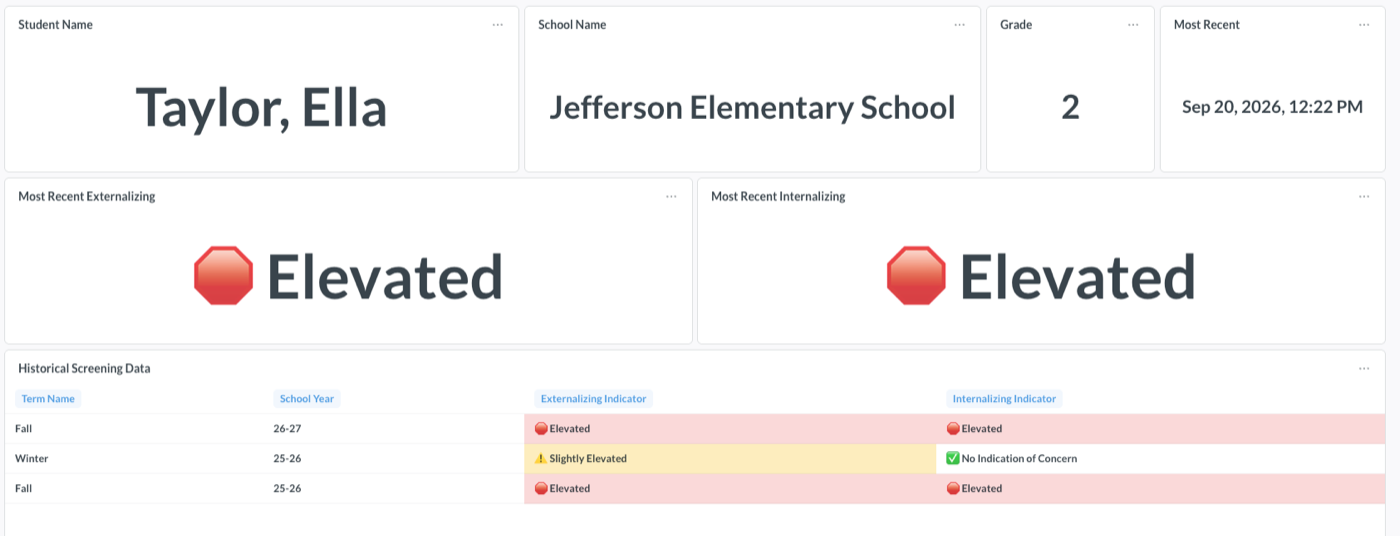
The history is the part worth slowing down for. A student who was clear last spring and is elevated this fall is a fundamentally different conversation than a student who has been elevated the whole time:
- New elevation — something changed. Worth asking what.
- Persistent elevation — existing supports are not moving the needle; escalate rather than repeat.
- Improving — whatever is in place appears to be working. Keep it.
A single score is a snapshot. The trend is the story.
What to Do With What You See
- Start with Students to Watch. Review the short list rather than reading the whole roster top to bottom.
- Look at the history, not just today. A change between terms matters more than any single score.
- Bring it to your MTSS or grade-level team. Screening data is the start of a conversation, not a decision on its own.
- Remember what it is. A universal screener flags students for a closer look. It does not diagnose anything.
Screening is not diagnosis
An Elevated score means a student should get a closer look from people who know them. It is not a diagnosis, a label, or a placement decision, and it should never be used as one on its own.
Getting Help
Click the green question mark in the bottom-right corner of any page, type what is going on, and send. It goes directly to the Standard Education support team and is usually answered within one business day.
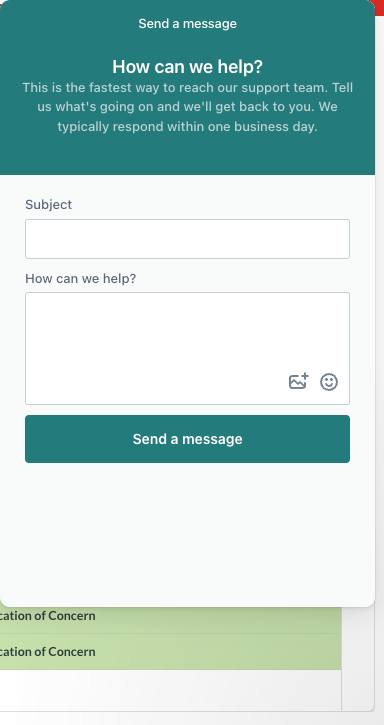
Common things worth sending:
- A student is missing from your roster
- The numbers do not look right for your class
- You cannot get into the dashboard
Related Guides
- Read SRSS Results — interpreting the output view step by step
- Score Interpretation Guide — cut scores and tier definitions
- SRSS-IE Overview — the items behind each score
- Scores Dashboard and Exports — the district-level view of the same data